
JOSH'S DATA ANALYTICS PORTFOLIO
A data science enthusiast, business and data analyst, research and development advocate.
A data science enthusiast, business and data analyst, research and development advocate.
Hi, my name is Joshua Onu, and I work remotely as a freelance data analyst. I hold a Bachelors's degree in science (Economics and Statistics, University of Benin, Benin City).
I am trained and experienced in questionnaire design, with a background in Economics and Statistics. As an IBM Data Science Professional certified analyst, I can offer support on improving data collection, transformation, unification, and predictive analysis.
I am Tableau trained, with extensive knowledge of data visualization best-practices. I have experince creating interactive tools and static infographs.
I am available for short-term projects and remote jobs. Please reach out by mail onujoshua123@gmail.com, phone:(+234)81-555-80-129 or LinkedIn
DATA VISUALIZATION PROJECTS
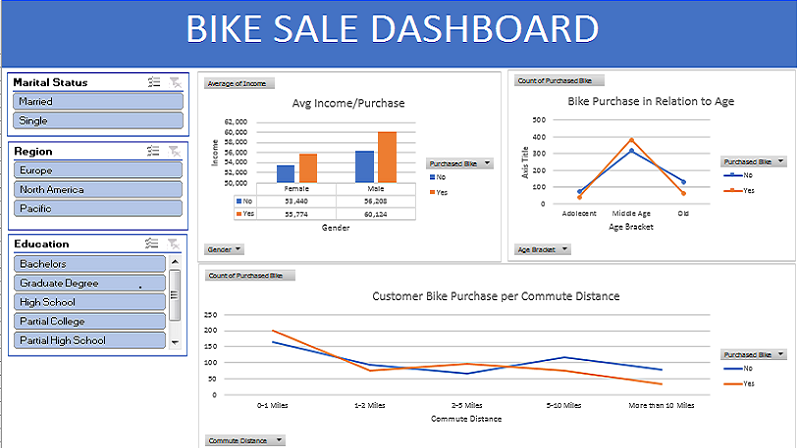
Created a dashboard that analyzes bike sales data. The data contains income, age, commute distance and other contextual information for hundreds of customers from across different regions. Analysis was done in Microsoft Excel.
• Male gender purchased more bikes compared to the female gender.
• Customer with higher income purchased more bikes compared to the lower income customers.
• Middle aged customers purchased more bikes compared to other age brackets.
• Shorter commute distance purchsed more bikes compared to other distances.
• Company's advertisement budget should be slightly raised to acquire more customers.
• Advertisement campaigns should be targeted at male gender and middle aged customers.
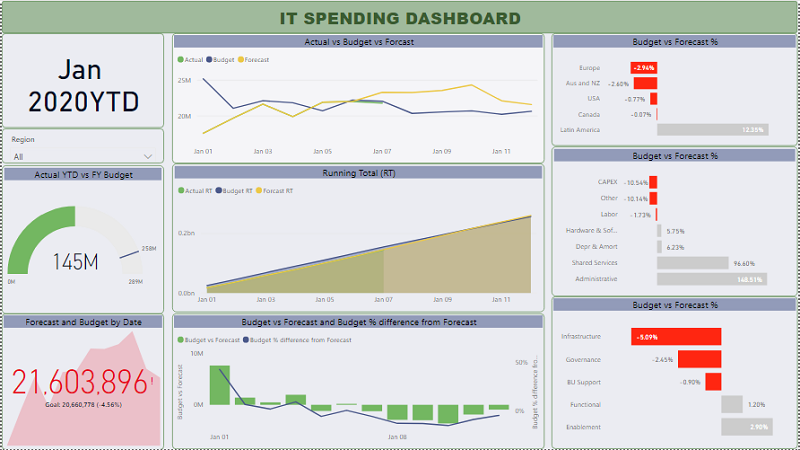
Created a dashboard that analyzes Information Technology (IT) budget versus spending. The data contains actual spending, budget, forcast and other contextual information for regions, sectors and industries for the year 2020. Analysis was done in Microsoft PowerBI
• On the average, the first quater of 2020 recorded a surplus budget spending of 113M across all regions.
• Latin America recorded a 12% surplus budget spending compared to other regions which had a deficit IT budget.
• Europe recorded the highest negetive budget spending of -2.94%, Australia and New Zealand -2.60%, USA -0.77% and Canada 0.07%.
• Administrative cost showed a surplus compared to CAPEX which revealed a negative budget spending.
The link to workspace is not currently working due to PowerBI's sharing limiation without an organization subscription.
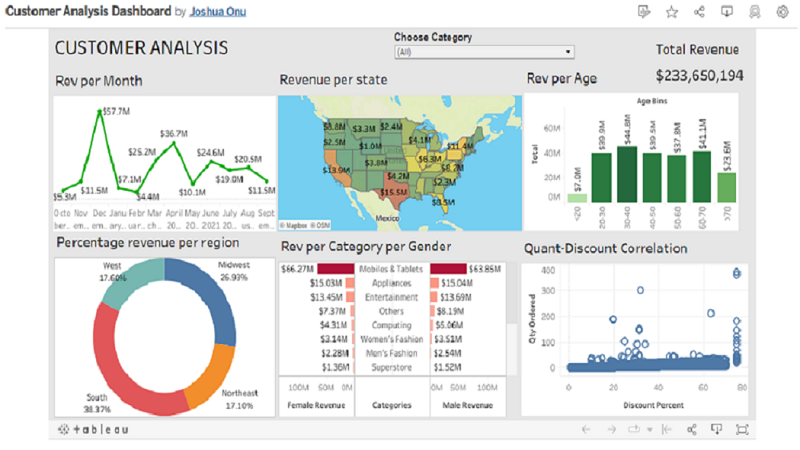
Created a dashboard that analyzes revenue from sales. The data contains revenue per month, revenue per age, revenue per state, revenue per gender and other contextual information for thousands of customers from across different regions. Analysis done in Tableau.
• More sales was recorded for the Month of December and April respectively. This could be as a result of the holiday seasons (Chrismas and Easter Holidays).
• The data also shows that, customers with age range (30-40) and (60-70) years had the highest purchase compare to other age range.
• The data also shows a positive correlation between discount on price and quantity demanded.
• Marketing department should design more engaging marketing campaigns during the month of December and April.
• Discounting should also be improved upon to drive more sales.
SQL PROJECTS

In this project, I exployed Covid 19 Data Set using Microsft SQL Server.
• Total Cases vs Total Deaths (Compared those who had covid and later died). Nigeria as at 30th of April, 2021 had 1.24% death rate.
• Viewed Countries with most Infection Rate and thier Population. Adorra has the highest percentage of covid infection per population.
• Veiwed, Country with Highest Death Rate per Population. United States had the highest with 576,232 deaths... e.t.c

Did some data cleaning on a raw (Nashville housing Data Set) and made it more siutable for exploration. Cleaning was done in Microsoft SQL Server.
• Standardized data format (sale date) by converting from date/time format to ordinary date format
• Cleaned property address data (populating null value) by joining the table to itself (i.e, if x=y then y=x)
• Broke out address into individual columns (Address, City, State) also deleted unused column using (DROP Command)
• Converted 'y' and 'n' to yes or no in (sold as vacant) field... e.t.c

In this project, exploration was done on (Video Game Sales Data Set) using Microsft SQL Server.
•Viewed purchasing choice across several regions. Wii gaming console has the highest number of sales in the Europe and North America, while GB (Game Boy) has the highest sales in Japan.
• Viewed purchasing choice across several regions. Europians and North Americans tends towards purchasing more (sport) genre games, while the Japanese prefared (Role playing) genre games.
• Game publisher (Nitendo) was a uniform purchase chioce across all regions.
• Year 2006 recorded highest number of game sales across all region, followed by year 1985, 2008 and 2009 respectively.
PYTHON PROJECTS

This project analysed variables responsible for the gross revenue from movies.
• Dependent Varaible: Gross Earning
• Independent Variables: (Budget, movie score, votes, year of release, runtime, rating, director, writer, star, genre and company)
• The Gross Earnings of a movie is highly dependent on Budget with a correlation value of 0.75
• The Gross Earnings of a movie is also dependent on votes with a correlation value of 0.63

In this project, I analyzed stock/revenue data of Tesla and GameStop to help make good investment chioce.
• Used 'yfinance' and (Ticker) function to extract Tesla and GameStop stock data.
• Used Webscraper to extract Tesla and GameStop revenue data.
• Plotted Tesla and GameStop Stock graph using the (make_graph) function.